Installation
# Install from local source package
install.packages("path/to/Rclade_1.0.0.tar.gz", repos = NULL, type = "source")
Basic Usage
The simplest way to create a timetree visualization using the built-in example data:
library(Rclade)

# Load built-in example tree (50 tips, GTDB-style labels)
data(example_tree)

# Plot with phylum-level collapsing (no timescale for speed)
p <- plot_timetree(example_tree, rank = "phylum",
                   taxonomy_format = "GTDB",
                   add_timescale = FALSE)
#>
#> ============================================================
#>            Rclade: Phylogenetic Tree Visualization
#> ============================================================
#> 2026-09-15T16:12:57.508+00:00 | INFO     | Starting plot_timetree pipeline
#> 2026-09-15T16:12:57.509+00:00 | INFO     | Tree input               : phylo object
#> 2026-09-15T16:12:57.509+00:00 | INFO     | Rank                     : phylum
#> 2026-09-15T16:12:57.510+00:00 | INFO     | Layout                   : rectangular
#> 2026-09-15T16:12:57.510+00:00 | INFO     | Unit                     : auto
#> 2026-09-15T16:12:57.511+00:00 | INFO     | Step 1/7: Input validation and reading
#>
#>   --------------------------------------------------
#>   >> Input Validation
#>   --------------------------------------------------
#> 2026-09-15T16:12:57.512+00:00 | INFO     | Tips                     : 50
#> 2026-09-15T16:12:57.513+00:00 | INFO     | Internal nodes           : 49
#> 2026-09-15T16:12:57.513+00:00 | INFO     | Edge lengths range       : 40.1579 to 2758.4006
#> 2026-09-15T16:12:57.514+00:00 | INFO     | Input validation passed
#> 2026-09-15T16:12:57.515+00:00 | INFO     | Timer 'input_reading': 3 ms
#> 2026-09-15T16:12:57.515+00:00 | INFO     | Step 2/7: Taxonomy parsing
#> 2026-09-15T16:12:57.516+00:00 | INFO     | Using rank-based taxonomy: phylum
#> 2026-09-15T16:12:57.524+00:00 | INFO     | Detected format          : GTDB
#> 2026-09-15T16:12:57.525+00:00 | INFO     | Groups found             : 5
#> 2026-09-15T16:12:57.525+00:00 | INFO     | Timer 'taxonomy_parsing': 10 ms
#> 2026-09-15T16:12:57.526+00:00 | INFO     | Step 3/7: MRCA computation and monophyly check
#> 2026-09-15T16:12:57.526+00:00 | INFO     | Checking monophyly and computing MRCA for each group...
#> 2026-09-15T16:12:57.530+00:00 | INFO     | Valid groups for collapse: 5 out of 5 total groups
#> 2026-09-15T16:12:57.530+00:00 | INFO     | Valid MRCA nodes         : 5
#> 2026-09-15T16:12:57.531+00:00 | INFO     | Timer 'mrca_computation': 5 ms
#> 2026-09-15T16:12:58.361+00:00 | INFO     | Step 4/7: Color generation
#> 2026-09-15T16:12:58.368+00:00 | INFO     | Color palette            : viridis
#> 2026-09-15T16:12:58.369+00:00 | INFO     | Step 5/7: Tree rendering
#> ! # Invaild edge matrix for <phylo>. A <tbl_df> is returned.
#> ! # Invaild edge matrix for <phylo>. A <tbl_df> is returned.
#> 2026-09-15T16:12:58.577+00:00 | INFO     | Collapsing 5 clades...
#> 2026-09-15T16:12:58.606+00:00 | INFO     | Clade collapse complete
#> 2026-09-15T16:12:58.607+00:00 | INFO     | Timer 'tree_rendering': 237 ms
#> 2026-09-15T16:12:58.607+00:00 | INFO     | Step 6/7: Timescale integration
#>
#> ============================================================
#>                       Pipeline Complete
#> ============================================================
#> 2026-09-15T16:12:58.704+00:00 | INFO     |   Tips                        : 50
#> 2026-09-15T16:12:58.704+00:00 | INFO     |   Groups parsed               : 5
#> 2026-09-15T16:12:58.704+00:00 | INFO     |   Groups collapsed            : 5
#> 2026-09-15T16:12:58.705+00:00 | INFO     |   Singleton groups            : 0
#> 2026-09-15T16:12:58.705+00:00 | INFO     |   Skipped (non-monophyletic)  : 0
#> 2026-09-15T16:12:58.706+00:00 | INFO     |   Skipped (root/zero-tip)     : 0
#> 2026-09-15T16:12:58.706+00:00 | INFO     |   Taxonomy format             : GTDB
#> 2026-09-15T16:12:58.706+00:00 | INFO     |   Layout                      : rectangular
#> 2026-09-15T16:12:58.707+00:00 | INFO     |   Timescale                   : disabled
#> 2026-09-15T16:12:58.707+00:00 | INFO     | plot_timetree completed successfully
print(p)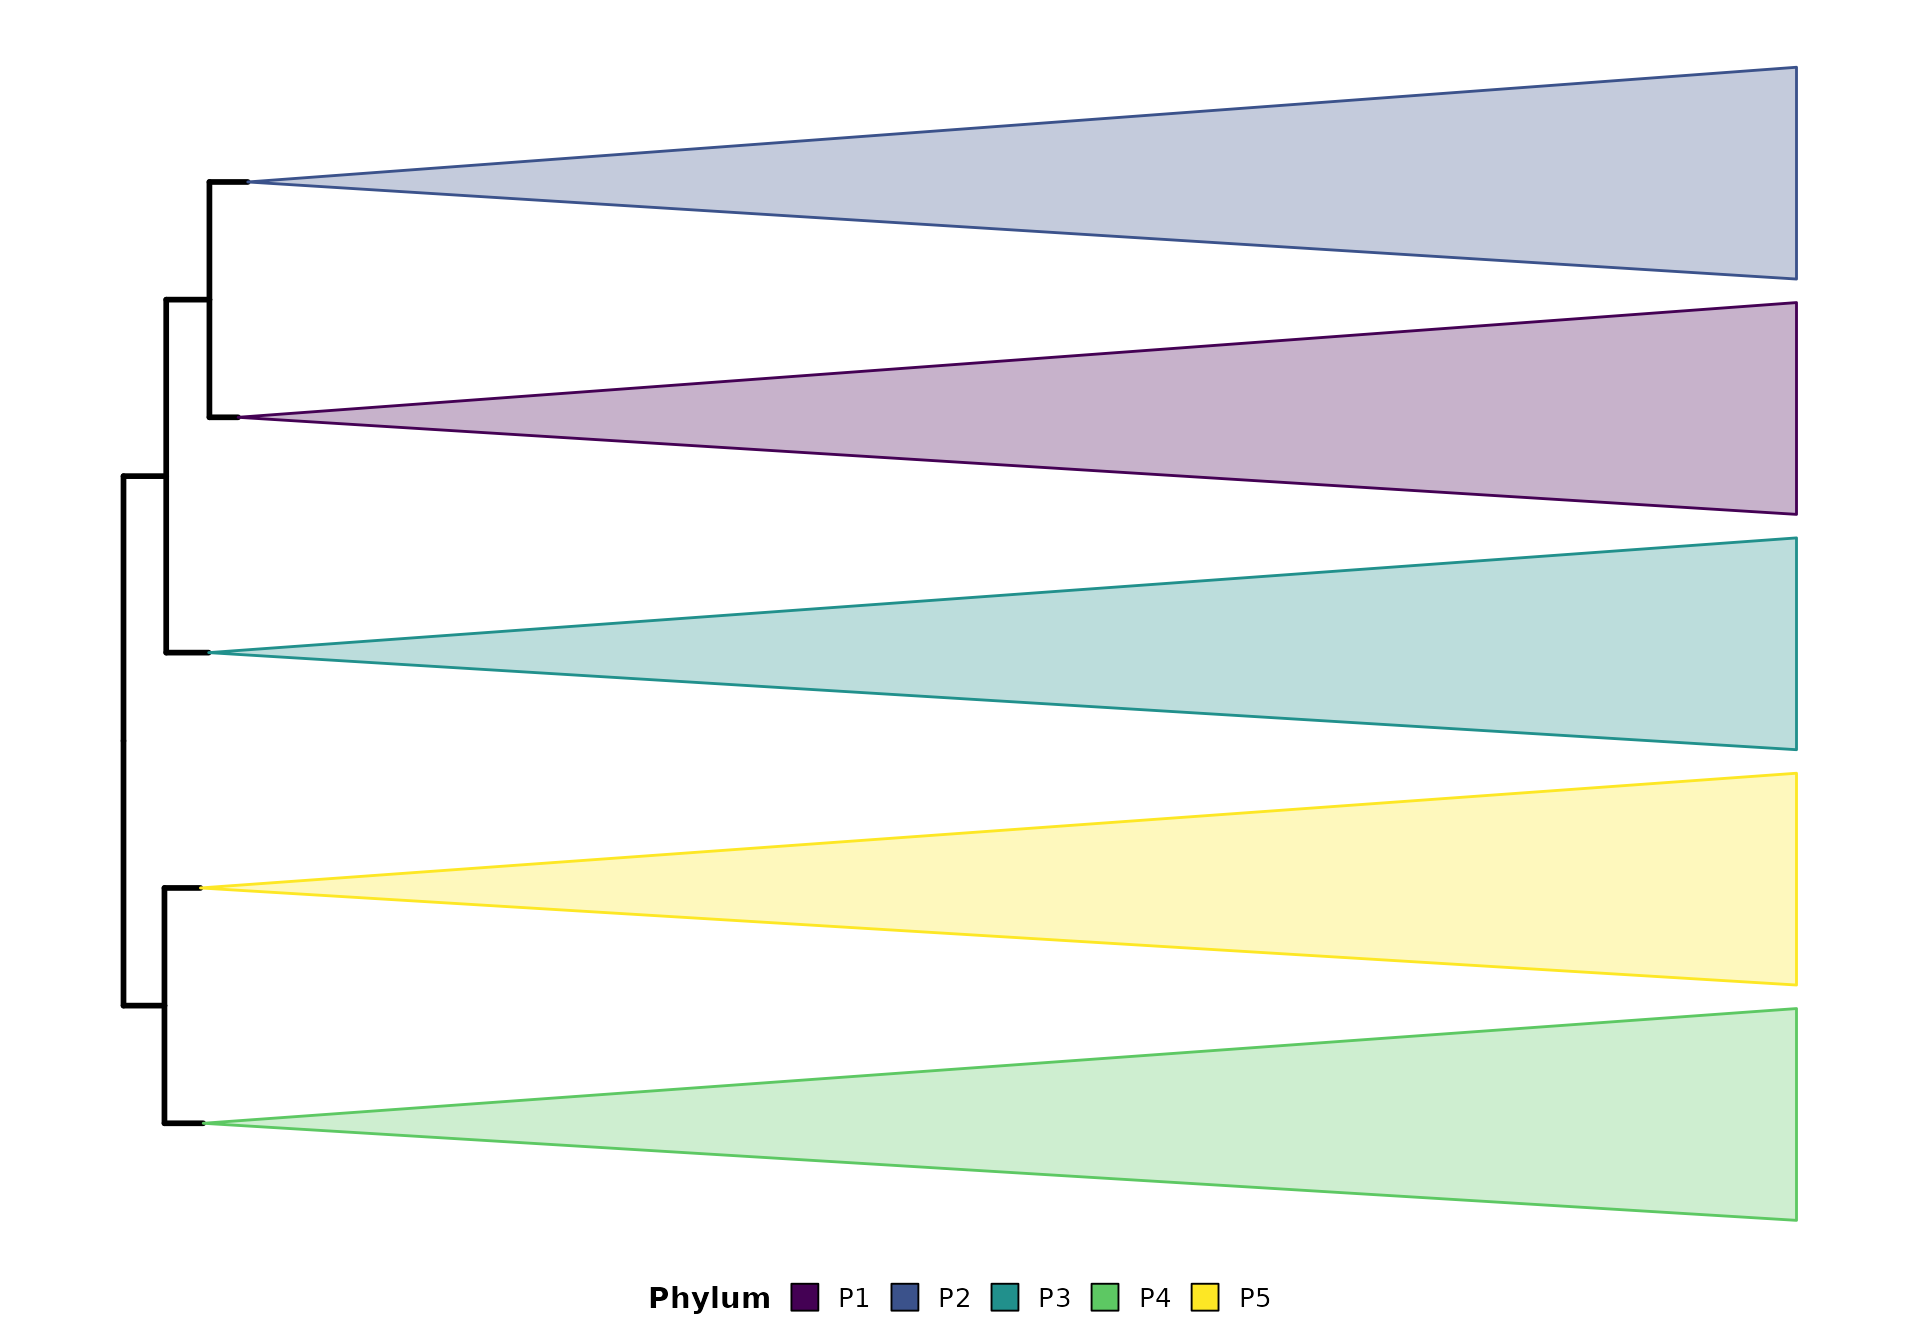
Adding Titles
Use main_title and sub_title to add
centered titles:
p <- plot_timetree(example_tree, rank = "phylum",
                   taxonomy_format = "GTDB",
                   add_timescale = FALSE,
                   main_title = "GTDB Bacterial Tree",
                   sub_title = "50 taxa | Phylum-level collapsing")
#>
#> ============================================================
#>            Rclade: Phylogenetic Tree Visualization
#> ============================================================
#> 2026-09-15T16:12:59.274+00:00 | INFO     | Starting plot_timetree pipeline
#> 2026-09-15T16:12:59.274+00:00 | INFO     | Tree input               : phylo object
#> 2026-09-15T16:12:59.275+00:00 | INFO     | Rank                     : phylum
#> 2026-09-15T16:12:59.275+00:00 | INFO     | Layout                   : rectangular
#> 2026-09-15T16:12:59.276+00:00 | INFO     | Unit                     : auto
#> 2026-09-15T16:12:59.276+00:00 | INFO     | Step 1/7: Input validation and reading
#>
#>   --------------------------------------------------
#>   >> Input Validation
#>   --------------------------------------------------
#> 2026-09-15T16:12:59.277+00:00 | INFO     | Tips                     : 50
#> 2026-09-15T16:12:59.277+00:00 | INFO     | Internal nodes           : 49
#> 2026-09-15T16:12:59.278+00:00 | INFO     | Edge lengths range       : 40.1579 to 2758.4006
#> 2026-09-15T16:12:59.279+00:00 | INFO     | Input validation passed
#> 2026-09-15T16:12:59.279+00:00 | INFO     | Timer 'input_reading': 3 ms
#> 2026-09-15T16:12:59.280+00:00 | INFO     | Step 2/7: Taxonomy parsing
#> 2026-09-15T16:12:59.280+00:00 | INFO     | Using rank-based taxonomy: phylum
#> 2026-09-15T16:12:59.288+00:00 | INFO     | Detected format          : GTDB
#> 2026-09-15T16:12:59.288+00:00 | INFO     | Groups found             : 5
#> 2026-09-15T16:12:59.289+00:00 | INFO     | Timer 'taxonomy_parsing': 9 ms
#> 2026-09-15T16:12:59.295+00:00 | INFO     | Step 3/7: MRCA computation and monophyly check
#> 2026-09-15T16:12:59.296+00:00 | INFO     | Checking monophyly and computing MRCA for each group...
#> 2026-09-15T16:12:59.298+00:00 | INFO     | Valid groups for collapse: 5 out of 5 total groups
#> 2026-09-15T16:12:59.299+00:00 | INFO     | Valid MRCA nodes         : 5
#> 2026-09-15T16:12:59.299+00:00 | INFO     | Timer 'mrca_computation': 3 ms
#> 2026-09-15T16:12:59.300+00:00 | INFO     | Step 4/7: Color generation
#> 2026-09-15T16:12:59.301+00:00 | INFO     | Color palette            : viridis
#> 2026-09-15T16:12:59.302+00:00 | INFO     | Step 5/7: Tree rendering
#> ! # Invaild edge matrix for <phylo>. A <tbl_df> is returned.
#> ! # Invaild edge matrix for <phylo>. A <tbl_df> is returned.
#> 2026-09-15T16:12:59.417+00:00 | INFO     | Collapsing 5 clades...
#> 2026-09-15T16:12:59.446+00:00 | INFO     | Clade collapse complete
#> 2026-09-15T16:12:59.446+00:00 | INFO     | Timer 'tree_rendering': 144 ms
#> 2026-09-15T16:12:59.447+00:00 | INFO     | Step 6/7: Timescale integration
#>
#> ============================================================
#>                       Pipeline Complete
#> ============================================================
#> 2026-09-15T16:12:59.581+00:00 | INFO     |   Tips                        : 50
#> 2026-09-15T16:12:59.582+00:00 | INFO     |   Groups parsed               : 5
#> 2026-09-15T16:12:59.582+00:00 | INFO     |   Groups collapsed            : 5
#> 2026-09-15T16:12:59.583+00:00 | INFO     |   Singleton groups            : 0
#> 2026-09-15T16:12:59.583+00:00 | INFO     |   Skipped (non-monophyletic)  : 0
#> 2026-09-15T16:12:59.583+00:00 | INFO     |   Skipped (root/zero-tip)     : 0
#> 2026-09-15T16:12:59.584+00:00 | INFO     |   Taxonomy format             : GTDB
#> 2026-09-15T16:12:59.584+00:00 | INFO     |   Layout                      : rectangular
#> 2026-09-15T16:12:59.585+00:00 | INFO     |   Timescale                   : disabled
#> 2026-09-15T16:12:59.585+00:00 | INFO     | plot_timetree completed successfully
print(p)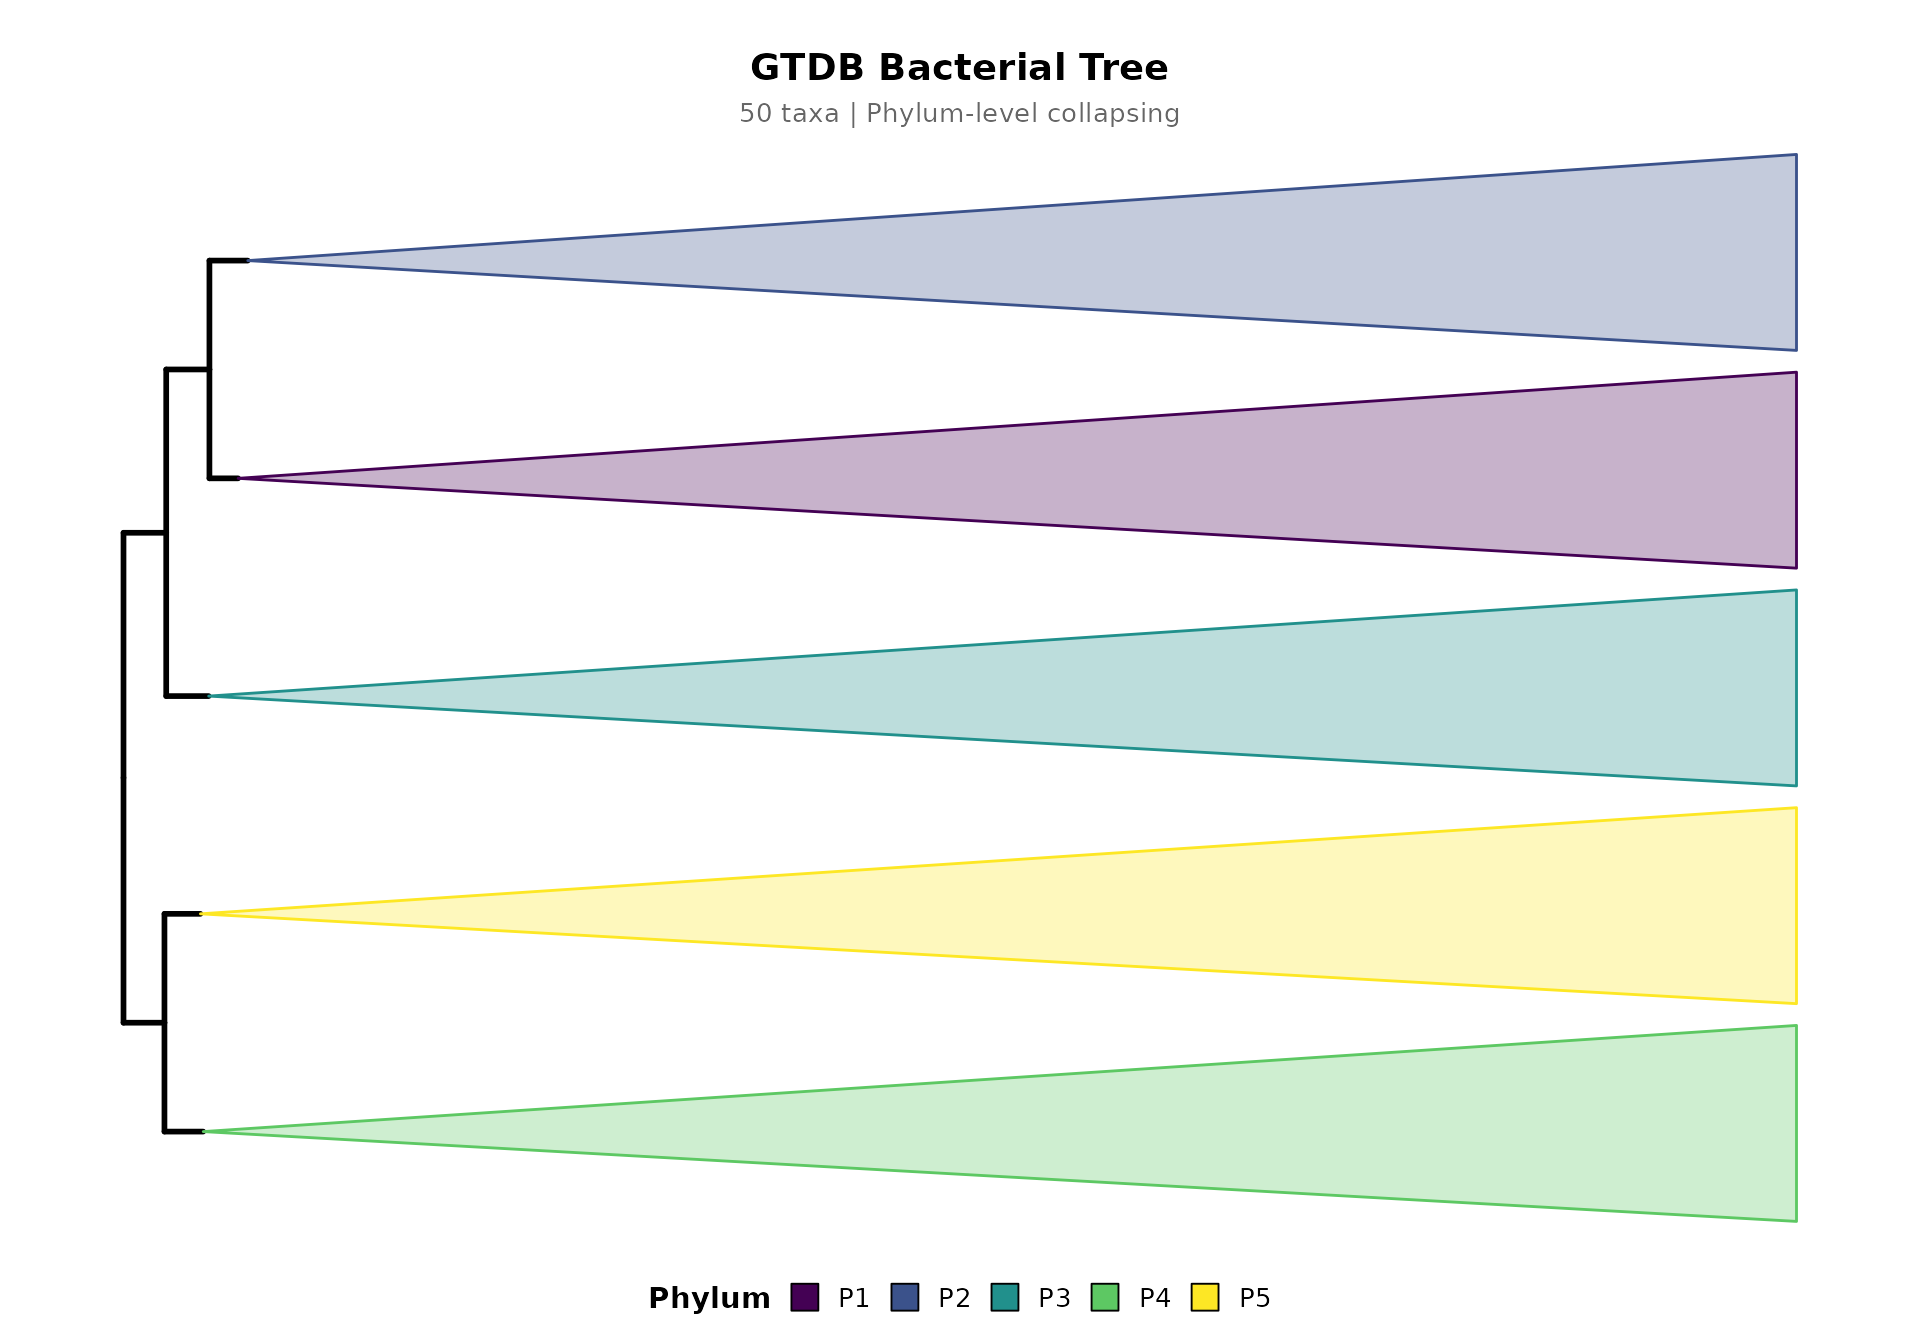
Summarizing Results
Use summarize_timetree() to inspect the collapse
metadata:
p <- plot_timetree(example_tree, rank = "phylum",
                   taxonomy_format = "GTDB",
                   add_timescale = FALSE)
#>
#> ============================================================
#>            Rclade: Phylogenetic Tree Visualization
#> ============================================================
#> 2026-09-15T16:13:00.220+00:00 | INFO     | Starting plot_timetree pipeline
#> 2026-09-15T16:13:00.221+00:00 | INFO     | Tree input               : phylo object
#> 2026-09-15T16:13:00.221+00:00 | INFO     | Rank                     : phylum
#> 2026-09-15T16:13:00.222+00:00 | INFO     | Layout                   : rectangular
#> 2026-09-15T16:13:00.222+00:00 | INFO     | Unit                     : auto
#> 2026-09-15T16:13:00.222+00:00 | INFO     | Step 1/7: Input validation and reading
#>
#>   --------------------------------------------------
#>   >> Input Validation
#>   --------------------------------------------------
#> 2026-09-15T16:13:00.224+00:00 | INFO     | Tips                     : 50
#> 2026-09-15T16:13:00.224+00:00 | INFO     | Internal nodes           : 49
#> 2026-09-15T16:13:00.224+00:00 | INFO     | Edge lengths range       : 40.1579 to 2758.4006
#> 2026-09-15T16:13:00.225+00:00 | INFO     | Input validation passed
#> 2026-09-15T16:13:00.226+00:00 | INFO     | Timer 'input_reading': 3 ms
#> 2026-09-15T16:13:00.226+00:00 | INFO     | Step 2/7: Taxonomy parsing
#> 2026-09-15T16:13:00.227+00:00 | INFO     | Using rank-based taxonomy: phylum
#> 2026-09-15T16:13:00.235+00:00 | INFO     | Detected format          : GTDB
#> 2026-09-15T16:13:00.235+00:00 | INFO     | Groups found             : 5
#> 2026-09-15T16:13:00.236+00:00 | INFO     | Timer 'taxonomy_parsing': 9 ms
#> 2026-09-15T16:13:00.236+00:00 | INFO     | Step 3/7: MRCA computation and monophyly check
#> 2026-09-15T16:13:00.237+00:00 | INFO     | Checking monophyly and computing MRCA for each group...
#> 2026-09-15T16:13:00.239+00:00 | INFO     | Valid groups for collapse: 5 out of 5 total groups
#> 2026-09-15T16:13:00.240+00:00 | INFO     | Valid MRCA nodes         : 5
#> 2026-09-15T16:13:00.240+00:00 | INFO     | Timer 'mrca_computation': 3 ms
#> 2026-09-15T16:13:00.241+00:00 | INFO     | Step 4/7: Color generation
#> 2026-09-15T16:13:00.242+00:00 | INFO     | Color palette            : viridis
#> 2026-09-15T16:13:00.243+00:00 | INFO     | Step 5/7: Tree rendering
#> ! # Invaild edge matrix for <phylo>. A <tbl_df> is returned.
#> ! # Invaild edge matrix for <phylo>. A <tbl_df> is returned.
#> 2026-09-15T16:13:00.362+00:00 | INFO     | Collapsing 5 clades...
#> 2026-09-15T16:13:00.391+00:00 | INFO     | Clade collapse complete
#> 2026-09-15T16:13:00.392+00:00 | INFO     | Timer 'tree_rendering': 148 ms
#> 2026-09-15T16:13:00.392+00:00 | INFO     | Step 6/7: Timescale integration
#>
#> ============================================================
#>                       Pipeline Complete
#> ============================================================
#> 2026-09-15T16:13:00.479+00:00 | INFO     |   Tips                        : 50
#> 2026-09-15T16:13:00.480+00:00 | INFO     |   Groups parsed               : 5
#> 2026-09-15T16:13:00.480+00:00 | INFO     |   Groups collapsed            : 5
#> 2026-09-15T16:13:00.480+00:00 | INFO     |   Singleton groups            : 0
#> 2026-09-15T16:13:00.481+00:00 | INFO     |   Skipped (non-monophyletic)  : 0
#> 2026-09-15T16:13:00.481+00:00 | INFO     |   Skipped (root/zero-tip)     : 0
#> 2026-09-15T16:13:00.481+00:00 | INFO     |   Taxonomy format             : GTDB
#> 2026-09-15T16:13:00.482+00:00 | INFO     |   Layout                      : rectangular
#> 2026-09-15T16:13:00.482+00:00 | INFO     |   Timescale                   : disabled
#> 2026-09-15T16:13:00.483+00:00 | INFO     | plot_timetree completed successfully
summarize_timetree(p)
#> === Rclade Timetree Summary ===
#> Input tips: 50
#> Groups parsed (total): 5
#> Groups collapsed: 5
#> Singleton groups (1 tip, not collapsed): 0
#> Skipped non-monophyletic groups: 0
#> Skipped groups (root/zero-tip): 0
#> Displayed leaves after collapse: 5
#> Taxonomy format: GTDB
#> Collapse rank: phylum
#> Palette: viridis
#> Layout: rectangular
#> Timescale: no
#>
#> Group details:
#>   P1                              n=10  node=54
#>   P2                              n=10  node=63
#>   P3                              n=10  node=72
#>   P4                              n=10  node=82
#>   P5                              n=10  node=91
Saving Output
# Save to PDF
save_timetree(p, "output.pdf", width = 14, height = 10)

# One-line pipeline
# Note: the geological timescale requires an explicit branch-length unit
# (Rclade does not infer units); pass unit = "Ma" or unit = "Ga".
plot_timetree(example_tree, rank = "phylum", unit = "Ga", output = "output.pdf")
Taxonomy Quality Check
Before visualization, check how well your labels can be parsed:
summarize_taxonomy_quality(example_tree$tip.label, format = "GTDB")
#> === Taxonomy Label Parsing Quality Report ===
#> Total labels: 50
#> Detected format: GTDB
#>
#> Per-rank parse rates:
#>   kingdom        0.0% (0/50)
#>   domain       100.0% (50/50) ====================
#>   phylum       100.0% (50/50) ====================
#>   class        100.0% (50/50) ====================
#>   order          0.0% (0/50)
#>   family         0.0% (0/50)
#>   genus          0.0% (0/50)
#>   species        0.0% (0/50)
#>   subspecies     0.0% (0/50)
#>
#> All labels parsed successfully.
References & Acknowledgments
Rclade builds on the ggtree and deeptime R packages. If you use Rclade in published research, please cite Rclade along with these key dependencies:
- Yu G, Smith DK, Zhu H, Guan Y, Lam TT-Y (2017). “ggtree: an R package for visualization and annotation of phylogenetic trees with their covariates and other associated data.” Methods in Ecology and Evolution, 8(1), 28-36. doi:10.1111/2041-210X.12628
- Gearty W (2025). “deeptime: an R package that facilitates highly customizable and reproducible visualizations of data over geological time intervals.” Big Earth Data. doi:10.1080/20964471.2025.2537516
- Paradis E, Schliep K (2019). “ape 5.0: an environment for modern phylogenetics and evolutionary analyses in R.” Bioinformatics, 35(3), 526-528. doi:10.1093/bioinformatics/bty633